In the world of data analytics, making informed decisions is key to success. One tool that empowers you to do just that is Microsoft Power BI. In this blog, we'll explore advanced dynamic DAX (Data Analysis Expressions) functions in Power BI, specifically focusing on year-to-year and quarter-wise analysis. We'll cover best tips, common causes of errors, step-by-step processes, advantages and disadvantages, precautions for sensitive data, and conclude with a summary of what we've learned.
Best Tips for Power BI Advanced DAX Functions:
- Understand the Business Context: Before diving into DAX, comprehend the business context to choose the right metrics for year-to-year and quarter-wise analysis. This ensures your insights are relevant.
- Organize Your Data Model: A well-structured data model is the foundation of a successful Power BI report. Ensure your relationships are correctly established.
- Use CALCULATE Sparingly: The CALCULATE function can be resource-intensive. Use it judiciously, focusing on improving query performance.
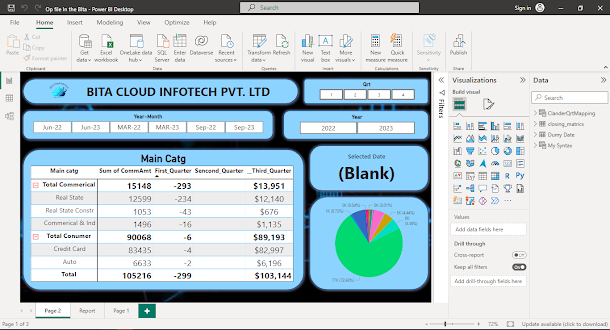
Third_Quarter =
VAR SelectedYear = SELECTEDVALUE('ClanderQrtMapping'[Year-Month],"Sep-23")
VAR Third_Quarter =
CALCULATE(
SUM(closing_matrics[CommAmt]),
FILTER(
closing_matrics,
RELATED('ClanderQrtMapping'[Year-Month]) = "Sep-23"
)
)
VAR Second_Quarter =
CALCULATE(
SUM('Dumy Date'[Amount]),
FILTER(
'Dumy Date',
RELATED('ClanderQrtMapping'[Year-Month]) = "Jun-22"
)
)
RETURN
IF(ISBLANK(SelectedYear), BLANK(), Third_Quarter - Second_Quarter)
Explanation:
This code is written in a programming language called DAX (Data Analysis Expressions), often used in Microsoft Power BI for data calculations. Let's break it down step by step in an easy-to-understand manner.
**First Section: Define a Variable**
```DAX
Third_Quarter =
```
This line is creating a variable called "Third_Quarter."
**Second Section: Variable Definitions**
```DAX
VAR SelectedYear = SELECTEDVALUE('ClanderQrtMapping'[Year-Month],"Sep-23")
VAR Third_Quarter = ...
VAR Second_Quarter = ...
```
In this section, we define three variables:
1. `SelectedYear` is assigned the value of the 'Year-Month' from a table named 'ClanderQrtMapping.' If there's no value, it defaults to "Sep-23."
2. `Third_Quarter` is calculated by summing the 'CommAmt' column from a table named 'closing_metrics' for rows where the 'Year-Month' in 'ClanderQrtMapping' is "Sep-23."
3. `Second_Quarter` is calculated by summing the 'Amount' column from a table named 'Dumy Date' for rows where the 'Year-Month' in 'ClanderQrtMapping' is "Jun-22."
**Third Section: Return Statement**
```DAX
RETURN
```
This section doesn't have any calculations but is used to specify what the DAX formula should return.
In summary, this DAX code defines two variables, 'Third_Quarter' and 'Second_Quarter,' that calculate sums of different columns from specific tables based on the condition that the 'Year-Month' matches a predefined value. The 'SelectedYear' variable is set to "Sep-23" from the 'ClanderQrtMapping' table if there's no other value. This code can be used to perform calculations and filter data in Power BI reports.
Common Causes of Error:
- Date Relationships: Errors often occur when date relationships aren't correctly defined, leading to inaccurate results in time-based calculations. Ensure you have a clear date hierarchy.
- Overly Complex DAX: Overly complex DAX formulas can be challenging to troubleshoot. Keep your calculations as simple as possible.
Step-by-Step Process:
- Data Import: Start by importing your data into Power BI.
- Create DAX Measures: Build DAX measures for year-to-year and quarter-wise analysis using functions like SAMEPERIODLASTYEAR and DATESYTD.
- Visualization: Add visuals to your report, utilizing the new DAX measures. Use line charts, column charts, or tables to display trends.
Advantages:
- Informed Decision-Making: Year-to-year and quarter-wise analysis allows you to spot trends, anomalies, and make informed decisions promptly.
- Granularity: Quarter-wise analysis provides a more granular view of data, which can be invaluable for businesses with seasonality.
Disadvantages:
- Data Volume: Handling large datasets can be resource-intensive and slow to process. Consider data optimization techniques.
- Complexity: Complex DAX measures may be challenging for novice users. Training may be necessary for your team.
Precautions for Sensitive Data:
- Data Encryption: Ensure data at rest and in transit is properly encrypted to protect sensitive information.
- Data Masking: Implement data masking to restrict access to sensitive data within Power BI.
Conclusion:
In this blog, we've dived deep into Power BI's advanced dynamic
DAX functions for year-to-year and quarter-wise analysis. We discussed the best tips to ensure success, common causes of errors to avoid, and a step-by-step process to follow.
The advantages include data-driven decisions and improved granularity, while the disadvantages revolve around data volume and complexity. When handling sensitive data, encryption and data masking are essential precautions.
Result:


 Launch your Graphy